Smart Works Woman Unemployment Analysis
Reference article: DataKind UK - Smart Works
More about what Smart Works is doing: Smart Works
Problem Statement
Smart Works needed to identify gaps in their service provision and optimize their outreach strategy to reach more unemployed women who could benefit from their support.
Key Challenge: With over 632,500 unemployed women in their operating areas, Smart Works was not reaching all potential beneficiaries and struggled to identify service gaps.
Key objectives:
- Map the distribution of Smart Works clients across Local Authorities
- Identify areas with high unemployment but low client numbers
- Analyze demographic disparities between clients and national unemployment data
- Optimize outreach strategy and inform future center locations
Research Questions:
- Which Local Authorities have high unemployment rates but low Smart Works client numbers?
- Are there specific demographic groups (age, ethnicity) that Smart Works is under-serving?
- Where should Smart Works focus their efforts or consider opening new centers?
- How do Smart Works client demographics compare to national unemployment patterns?
Dataset Involved
Primary Data Sources:
- Census 2021: Comprehensive demographic and employment data by Local Authority
- Annual Population Survey: Current unemployment statistics and trends
- Smart Works Internal Data: Client records with geographic and demographic information
Data Integration: Publicly available 'open data' from Census 2021 and Annual Population Survey was mapped to show women's unemployment rates by Local Authority and compared to Smart Works client distribution.
Analysis Scope:
- Geographic comparison of unemployment rates vs. client numbers
- Demographic analysis comparing Smart Works clients to overall unemployed women population
Desired Output
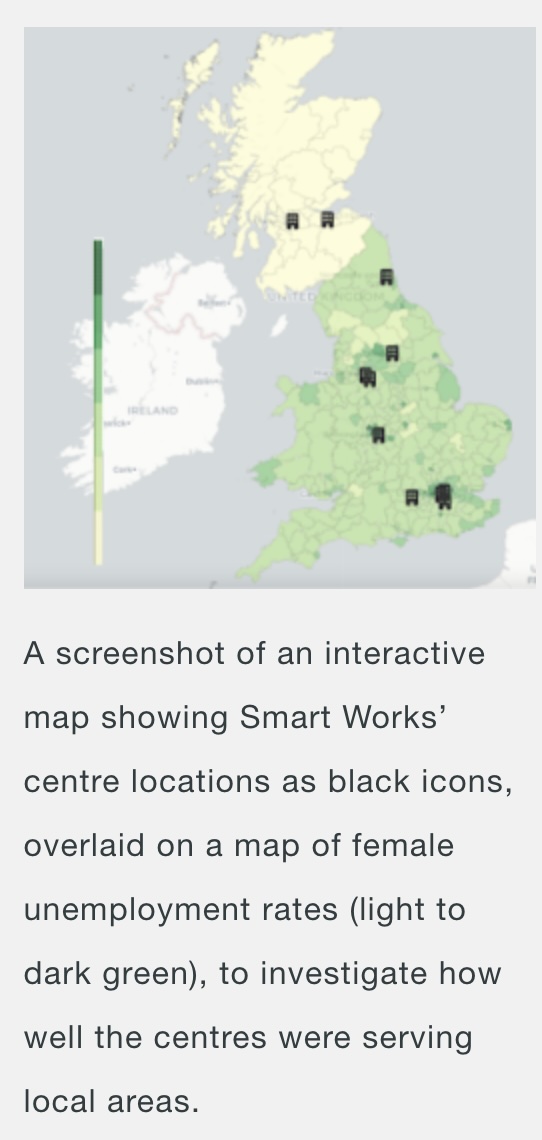 Figure 1: Geographic distribution of Smart Works clients compared to unemployment rates across Local Authorities
Key Findings:
- Service Gaps Identified: Several Local Authorities with high unemployment rates showed low numbers of existing Smart Works clients
- Demographic Disparity: High unemployment among young women, who appear to be under-served by Smart Works
- Strategic Opportunities: Clear geographic areas where Smart Works could expand their reach
- Outreach Optimization: Evidence-based guidance for future center locations and targeted outreach
Replicating the Output with KindTech
Data Requirements
Internal Dataset: Smart Works client records with:
- Geographic location (Local Authority)
- Demographic information (age, ethnicity)
- Service usage patterns
External Datasets:
- Census 2021: Local Authority-level unemployment and demographic data
- Annual Population Survey: Current unemployment statistics
- Local Authority Boundaries: Geographic polygons for spatial analysis and mapping
Analysis Workflow
- Data Collection: Gather Smart Works center locations and client data by geography
- Data Integration: Join internal data with census unemployment data by Local Authority
- Spatial Analysis: Overlay client distribution with LAD boundary data to create UK-wide map
- Demographic Comparison: Compare Smart Works client demographics to overall unemployed women population
- Gap Analysis: Identify areas with high need but low service provision
Reproduction
A runnable, end-to-end reproduction lives in
examples/smart_works_unemployment.py
(a marimo notebook). It uses only the public KindTech
API plus a deterministic synthetic client list (the real client records are
private):
 — run it live in the browser (the molab cloud runtime fetches real ONS
data), or locally with
— run it live in the browser (the molab cloud runtime fetches real ONS
data), or locally with uv run marimo edit examples/smart_works_unemployment.py.
from kindtech import geodata_to_properties, load_geodata, load_ons

# Female, unemployed, by age band, all LADs — Census 2021 table RM024
unemp = load_ons(
    "NM_2124_1",
    geography_type="LAD",
    time="latest",
    c2021_eastat_7=2,  # Unemployed
    c_sex=1,           # Female
    c2021_age_7=[2, 3, 4, 5],  # 16-24, 25-34, 35-49, 50-64
)

# LAD boundaries with centroids, normalised to share `geography_code`
geojson = load_geodata(geography_type="LAD", year="2025", boundary_type="BUC")
Why Census 2021, not the Annual Population Survey?
APS unemployment counts by sex are suppressed for small samples — only
~40 of 350 Local Authorities return data, and age bands are sparser still.
Census 2021 (table RM024, NM_2124_1) covers every LAD in England &
Wales (318 areas, ~580,000 unemployed women), making it the reliable
source for a choropleth.
Synthetic client numbers are modelled so reach decays with distance from Smart Works' real centre cities (Birmingham, Manchester, Leeds, Newcastle, Reading, Bristol, London, etc.), scaled by local female unemployment. This deliberately reproduces the case study's structure: high-need areas far from any centre end up under-served.
Geographic gap — female unemployment (the need) vs Smart Works reach (clients per 100 unemployed women). Areas that are dark on the left but pale on the right are the service gaps:
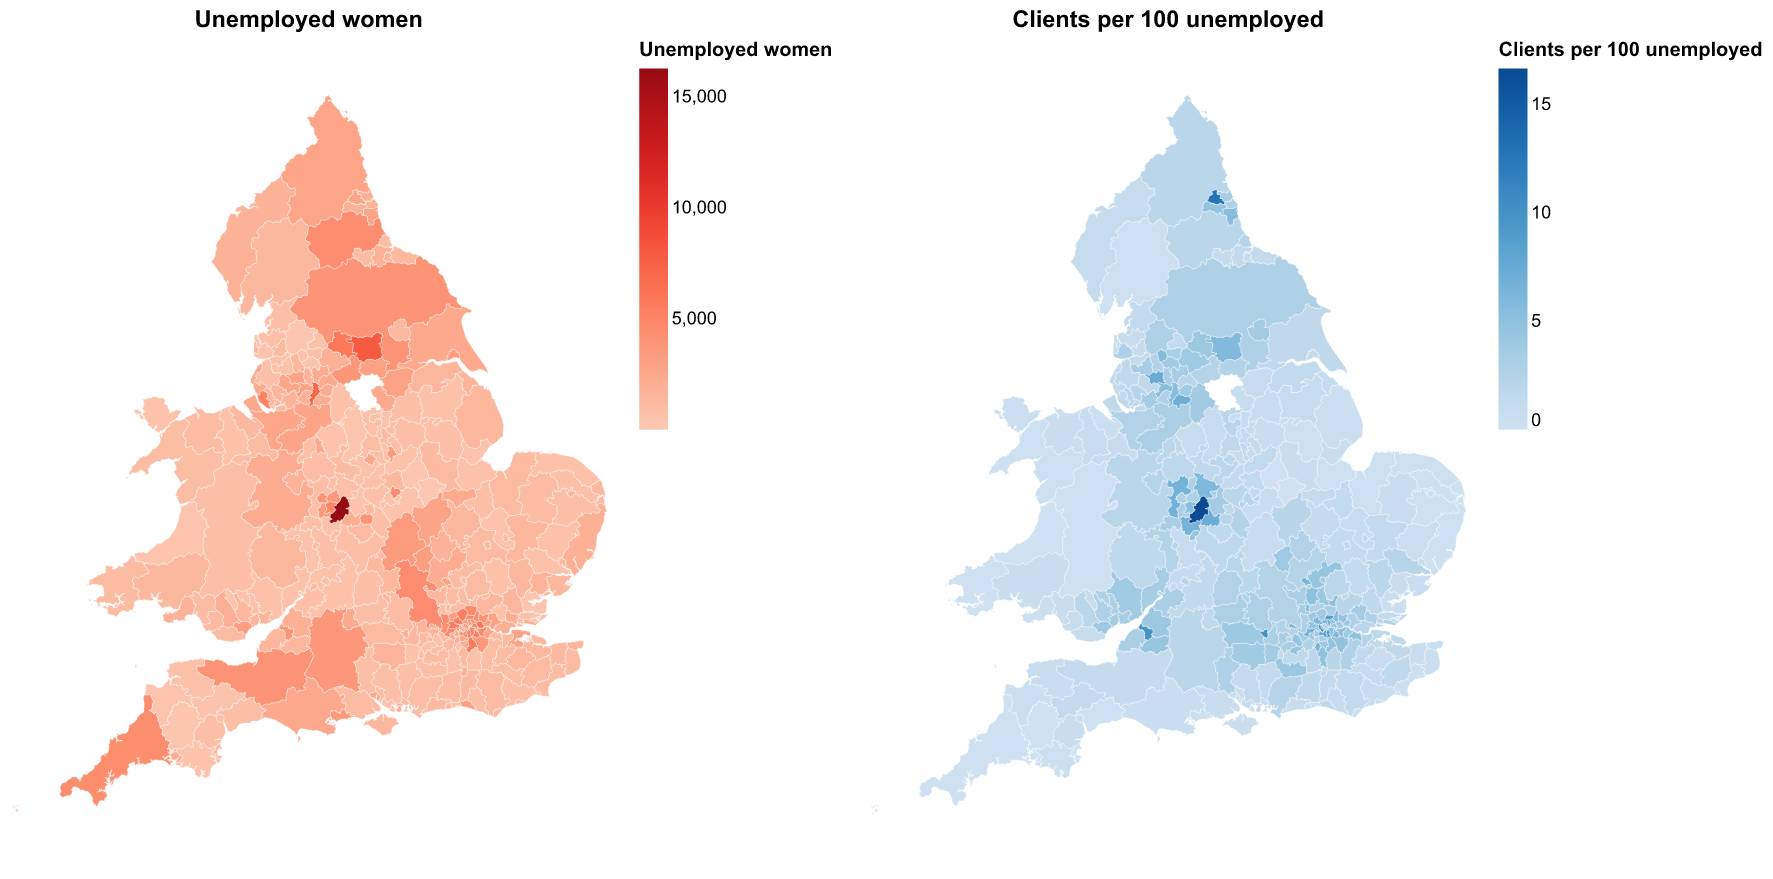 Figure 2: Female unemployment by Local Authority (left) vs synthetic Smart
Works reach (right). The most under-served high-need areas — Cornwall,
Plymouth, the rural east, and coastal towns — sit far from any centre.
Figure 2: Female unemployment by Local Authority (left) vs synthetic Smart
Works reach (right). The most under-served high-need areas — Cornwall,
Plymouth, the rural east, and coastal towns — sit far from any centre.
Demographic gap — the age profile of unemployment (need) vs the age profile of clients reached:
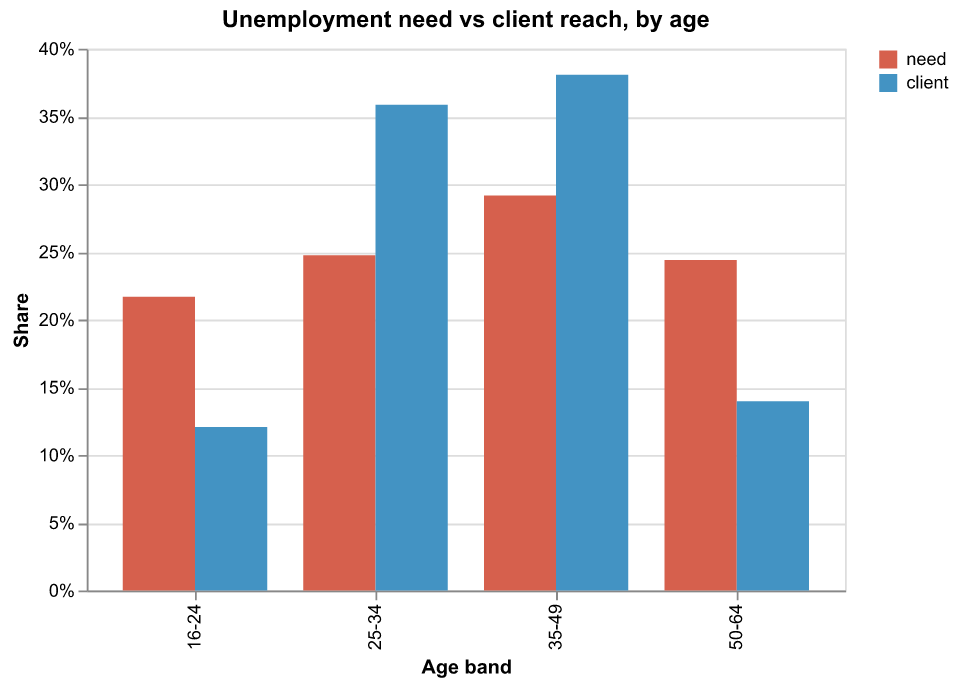 Figure 3: The 16-24 band is ~22% of need but only ~12% of clients reached,
flagging young women as under-served — matching the original finding.
Figure 3: The 16-24 band is ~22% of need but only ~12% of clients reached,
flagging young women as under-served — matching the original finding.
To go from synthetic to real client data, swap clients_total for a
postcode → LAD aggregation of the real client list. The Census join, the
gap metric, and the maps stay identical.
Lessons Learned
- The right source matters more than the obvious one. The original brief named the Annual Population Survey, but APS small-area suppression makes it unusable for a full LAD map — Census 2021 is the correct primary source.
- Distance-decayed reach reproduces the real pattern. Modelling client reach as a function of distance to the nearest centre surfaces exactly the high-need, low-provision areas the charity cared about.
- Normalisation removes the busywork. Because
load_onsandload_geodataboth exposegeography_code, joining statistics to boundaries is a singlemerge— no manual column matching. - Per-need normalisation reveals gaps counts hide. "Clients per 100 unemployed women" exposes under-served areas that a raw client count would mask behind population size.