Material Focus Recycling Analysis
Reference article: DataKind UK - Material Focus Recycling
More about what Material Focus Recycling is doing: Material Focus Recycling
Problem Statement
Material Focus needed to gather evidence to demonstrate to stakeholders what interventions would make the greatest difference in increasing electrical item recycling rates across the UK.
Key Research Questions:
- Where in the UK could Material Focus achieve the greatest impact if small electricals were recycled through major supermarkets?
- Do factors like proximity to collection points influence recycling rates in different areas?
- What barriers prevent individuals from recycling electrical goods?
Objective: To identify optimal locations for new collection points and understand the factors that influence recycling behavior, enabling Material Focus to encourage local authorities to fund additional infrastructure.
Dataset Involved
Internal Data:
- Existing recycling rates for electronic goods and general recycling
- Location of current recycling points across the UK
- Travel times from residential areas to nearest recycling facilities
External Data:
- Population density by geographic area
- Car ownership rates
- Housing types and demographics
- Other relevant socioeconomic variables
Desired Output
Travel Time Visualization: A comprehensive map showing average travel time in minutes to any recycling location across England, with travel times ranging from a maximum of 20 minutes to under six minutes.
Key Finding: The visualization revealed that a significant proportion of people across England have access to recycling points within 12 minutes of travel time, indicating good baseline infrastructure coverage.
Behavioral Analysis: Material Focus was particularly interested in understanding what factors would influence new individuals to start recycling—not just optimizing for people already engaged in recycling. The analysis examined:
- Travel distance to recycling facilities
- Population density compared to recycling participation rates
- Availability of kerbside collection services
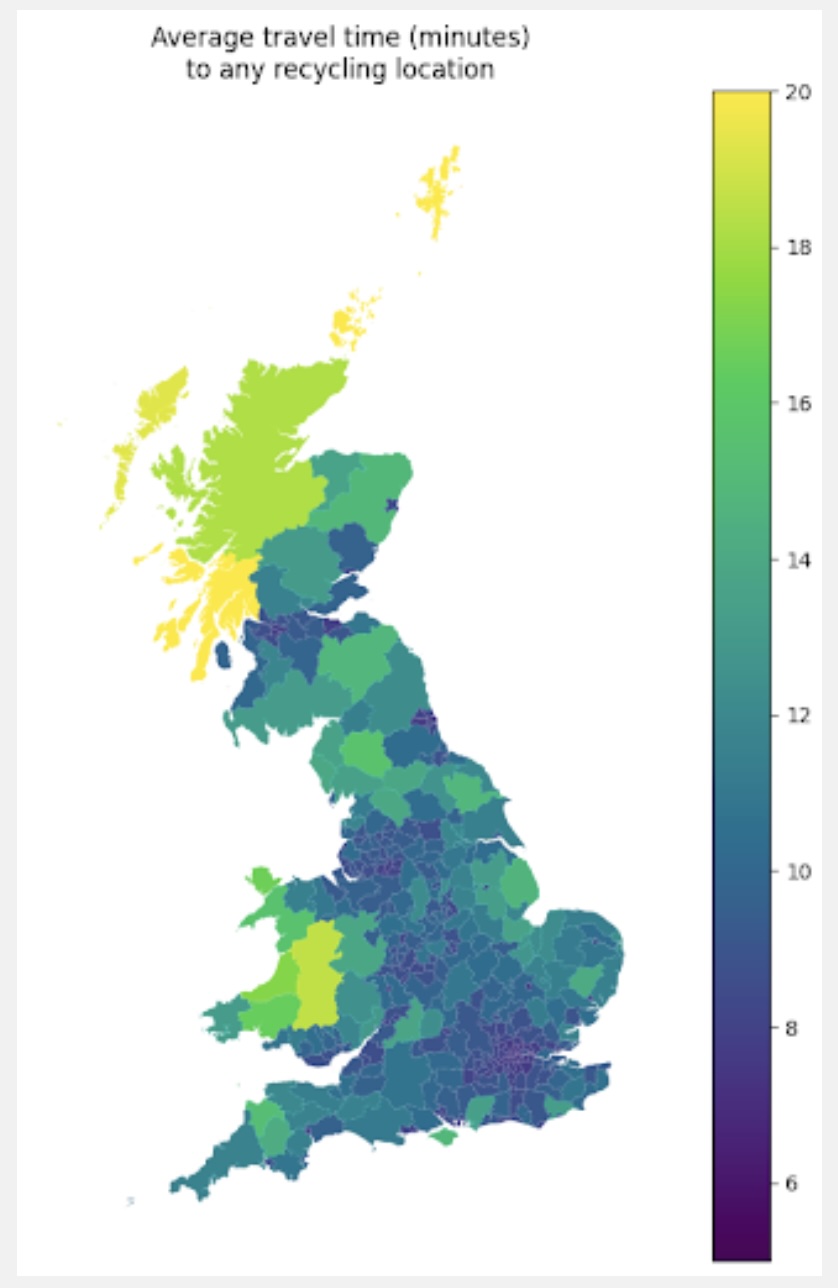 Figure 1: Average travel time in minutes to any recycling location for people living in the area, moving from a maximum of 20 minutes to under six minutes.
Replicating the Output with KindTech
Analysis Workflow
- Generate the recycling rate data at local authority level
- Combine with LAD boundary data to create a map of the UK
Or
- Locate the recycling points and generate average travel time to the nearest recycling point within LAD
- Combine with LAD boundary data to create a map of the UK
Reproduction
A runnable, end-to-end reproduction lives in
examples/material_focus_recycling.py
(a marimo notebook). It builds the headline travel-time
map from two KindTech connectors, joining on geography_code:
 — run it live in the browser (the molab cloud runtime fetches real ONS
data), or locally with
— run it live in the browser (the molab cloud runtime fetches real ONS
data), or locally with uv run marimo edit examples/material_focus_recycling.py.
from kindtech import load_geodata, geodata_to_properties, load_ons
import pandas as pd

# LAD boundaries carry LAT/LONG centroids
geojson = load_geodata(geography_type="LAD", year="2025", boundary_type="BUC")
geo = pd.DataFrame(geodata_to_properties(geojson, "LAD", 2025))

# Total population per LAD — so the headline is people-weighted, not area-weighted
pop = load_ons("population", geography_type="LAD", time="latest",
               measures=20100, gender=0, c_age=200)
The real collection-point list isn't public, so the notebook scatters 300 synthetic points where people live (supermarket take-back follows population) and measures the straight-line distance from each LAD centroid to the nearest one.
Straight-line distance, not road routing
The original mapped road travel time. This reproduction approximates it
with haversine distance converted to minutes at an effective 40 km/h,
capped at 20 minutes. That reproduces the pattern and the headline
statistic well, but it is not a true drive-time. A faithful road travel-time
map needs a routing engine (e.g. OSRM or
OpenRouteService); KindTech does not wrap
one yet. If more case studies need real travel time, a small kindtech
routing connector would be worth adding.
Travel-time map — minutes to the nearest recycling point per LAD:
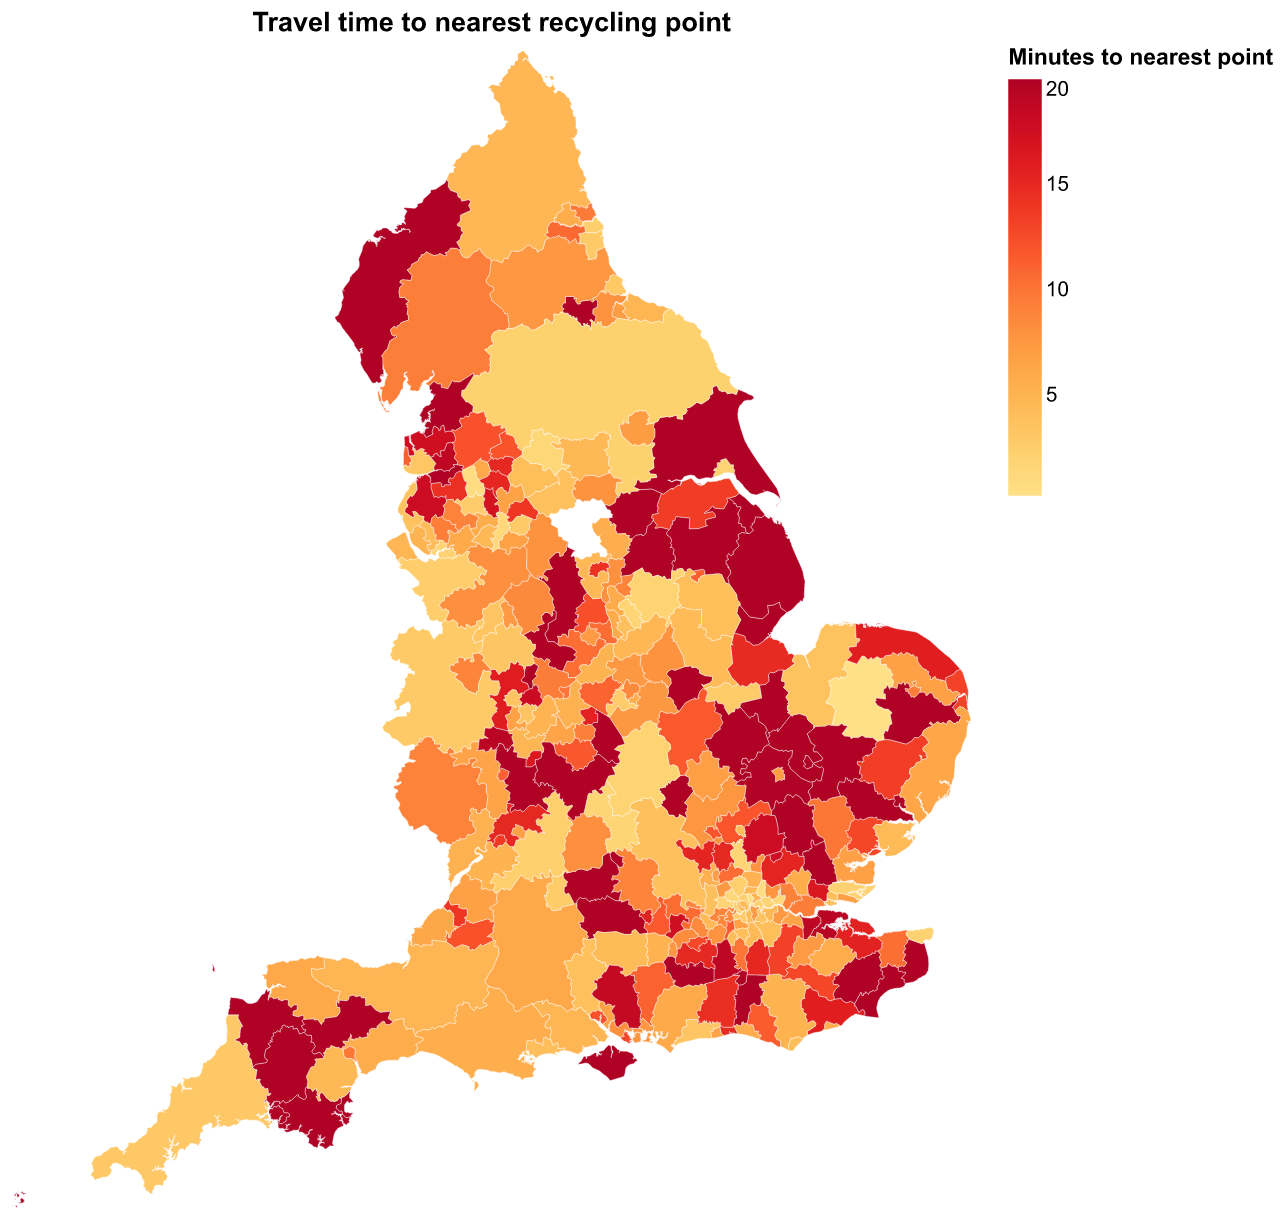 Figure 2: Approximate travel time (minutes) to the nearest recycling point.
~76% of people are within a 12-minute trip, with a long tail of harder-to-reach
rural authorities (dark) — candidates for new collection points.
Figure 2: Approximate travel time (minutes) to the nearest recycling point.
~76% of people are within a 12-minute trip, with a long tail of harder-to-reach
rural authorities (dark) — candidates for new collection points.
Does proximity influence recycling? Each LAD's travel time against a synthetic participation rate:
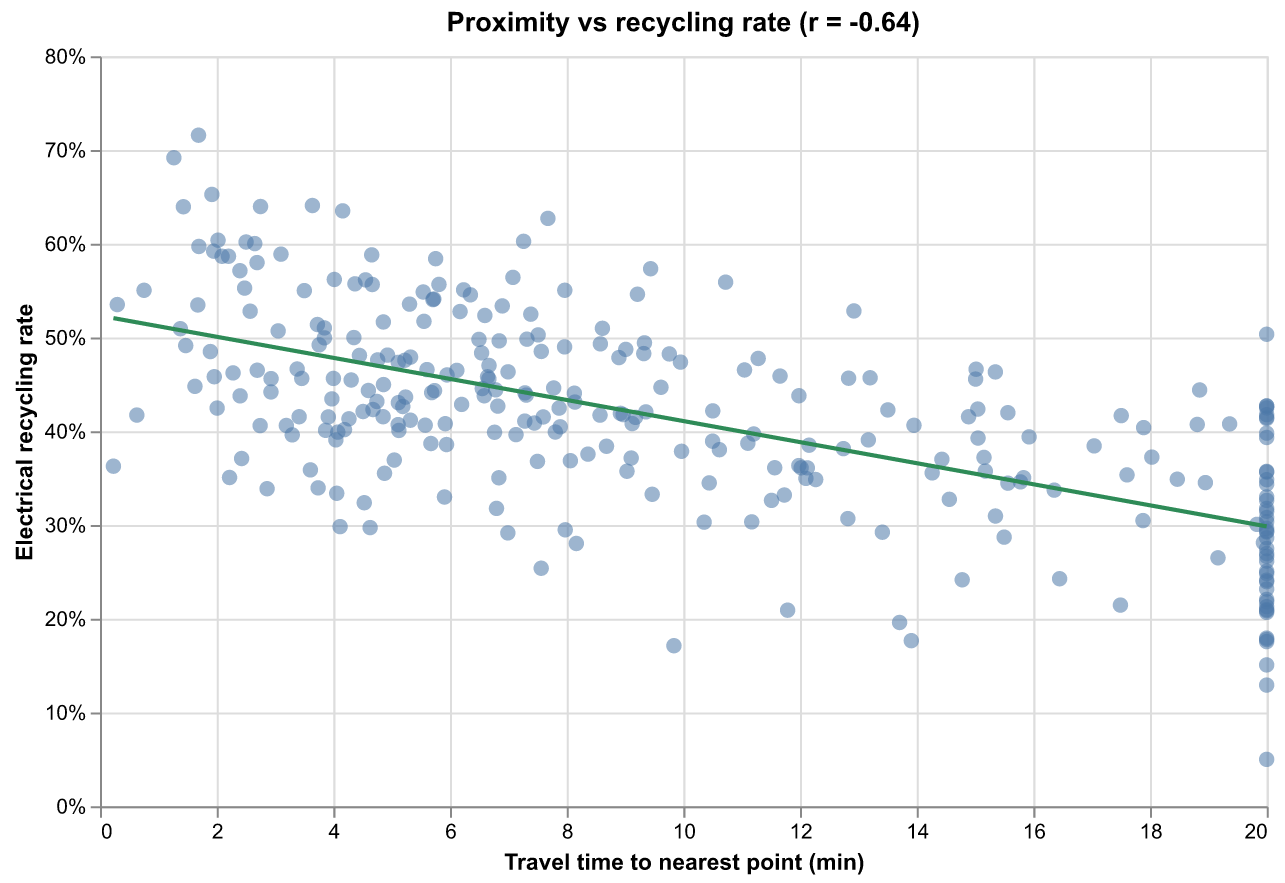 Figure 3: A real-but-loose downward trend — recycling falls as travel time
rises, the direction Material Focus argued, with proximity one driver among
several (car ownership, kerbside collection, demographics).
Figure 3: A real-but-loose downward trend — recycling falls as travel time
rises, the direction Material Focus argued, with proximity one driver among
several (car ownership, kerbside collection, demographics).
To run on real data, swap the synthetic points for Material Focus's actual collection-point coordinates and the synthetic rate for measured participation; the population join and maps are unchanged.
Lessons Learned
Key takeaways and recommendations:
- People-weighting matters: averaging travel time per area over-counts large rural authorities. Weighting by population reproduces the people-based headline ("most within 12 minutes") that an unweighted map would miss.
- Distance is a first-order proxy, routing is the refinement: straight-line distance gets the pattern and the access statistic right cheaply; a routing engine is only needed when the literal drive-time figure is the deliverable.
- Maps turn coverage into targets: ranking authorities by travel time points directly at where a new collection point cuts the longest trips — the evidence the campaign needed to lobby local authorities.
- Composable connectors: boundaries + population join on
geography_codewith no glue code, so the same workflow extends to car ownership, housing type or deprivation as further explanatory factors.